|
Trading Range Simulator
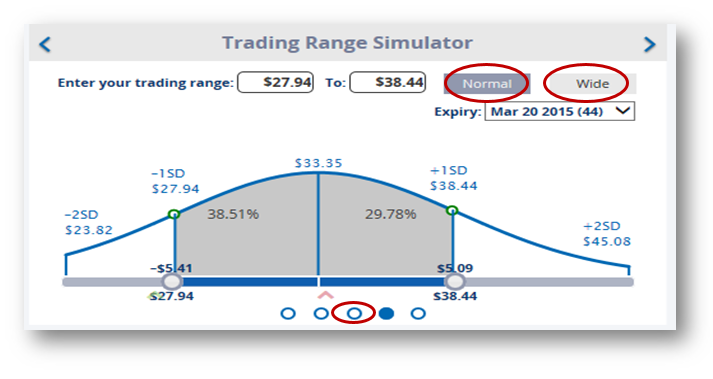
- It allows you to see the 1 and 2 Standard Deviation moves of the underlying stock. You can default to 1 Standard Deviation by clicking on the Normal button and 2 Standard Deviation by clicking on the Wide button.
- The P&L charts will be re-drawn and the Options Play Score will be recalculated based on the range you select.
-
Standard deviation is a measure of the price-fluctuations of an underlying. 68.27% of the historical movements lie within 1 standard deviation of the mean move. Likewise, 95.45% of the movements lie within 2 standard deviations of the mean move.
|